
Ì have just finished reading a book about randomness called The Drunkard's Walk: How Randomness Rules Our Lives
One of the interesting facts in the book is that people are not capable of making up a sequence of numbers that pass mathematical tests for randomness. For certain mathematical calculations strings of random numbers are required. In 1947 scientists at the RAND corporation created a system using electronic noise to generate random numbers. They did not succeed in generating a string of numbers that was entirely free of regularities but did produce results which were random enough to be useful. The numbers were published in 1955 as A Million Random Digits
I looked up the RAND book on Amazon and found a strange user review :
This is surely the most depressing book I have ever read. I am an amateur historian, who has spent many years analysing history and watching it repeat itself... or at least that is what I thought. After reading this book it is obvious that what I perceived to be recurring patterns, were if fact just random events being repeated randomly.
As a result, I no longer read history with the same enthusiasm. On the bright side, this book is a wonderful testament to man's ability to think the unthinkable. It also questions my sanity that I tried to read it in the first place!
Here is another from Amazon:
I took a class in statistics in college. I used this book to help me select random phone numbers for a poll I was conducting for my class project. (The most popular household cleanser in the greater Siouxland area is Bon Ami, by the way.) One of those phone calls was answered by the woman who is now my wife. We've been happily married for ten years! Thank you, RAND.
Below are three graphs from Mlodinow's books which I also found interesting:
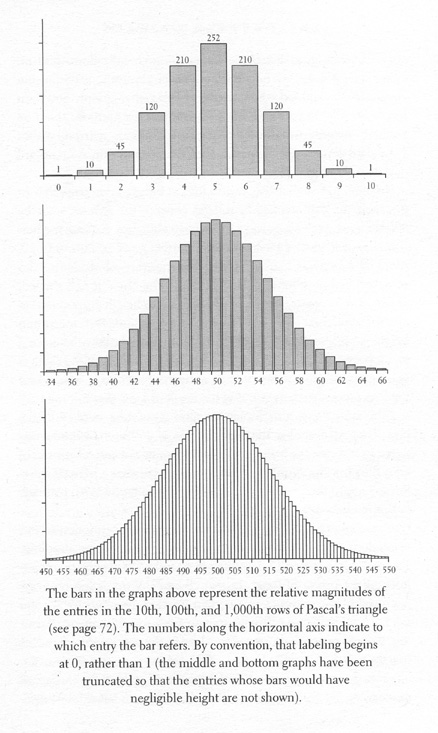 They show an example of 'normal distibution'. To explain this idea Mlodinow writes about an experiment in which 300 students were each asked to guess heads or tails in a series of ten coin tosses. When these results are presented in a graph they form a bell-shaped curve centred on 5 correct guesses. The curve drops to about two thirds of its maximum height between 3 and 4 correct guesses and between 6 and 7 correct guesses and tapers off in a bell shape with 0 and 10 correct guesses having the lowest heights. This type of curve is know as 'normal distribution'.
The graphs below chart the number in rows of pascal's triangle - a chart which can be used to show the number of possible combinations of given set of elements eg the number of ways 100 people can be seated at 10 tables.